Back to Prompts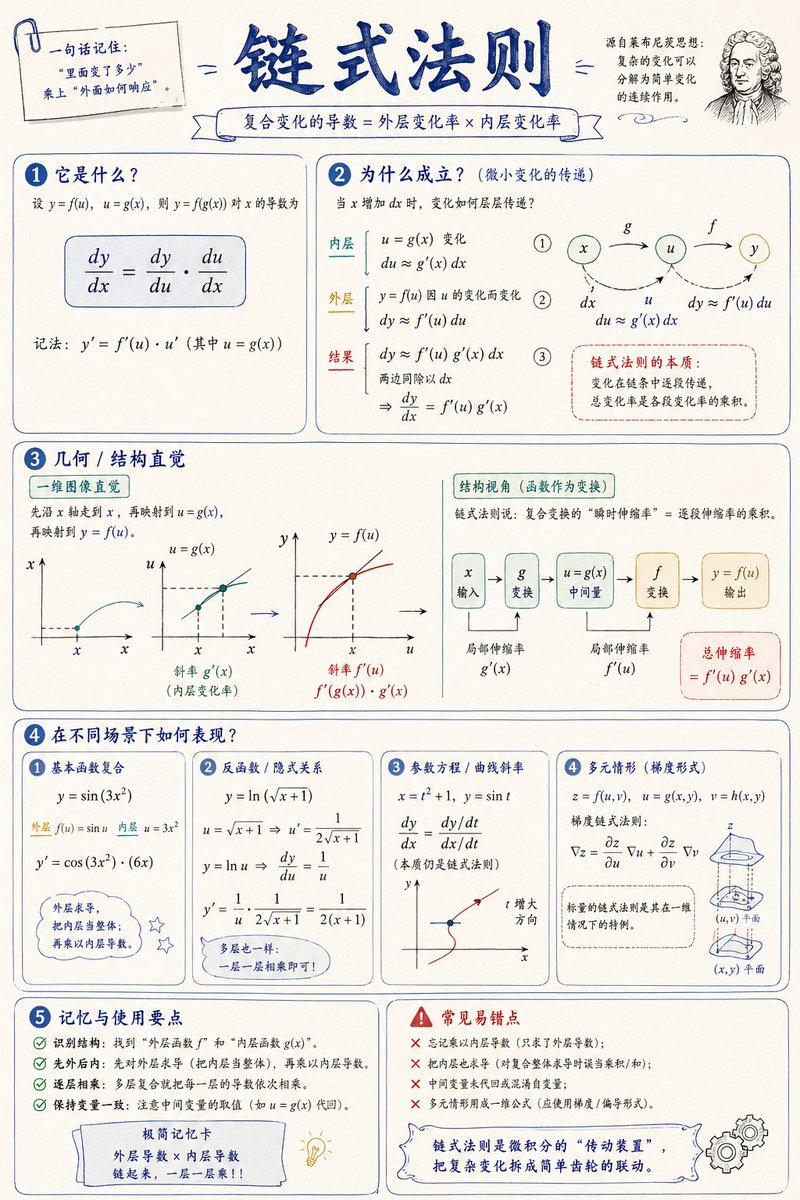
Mathematical Concept Visualization Infographic
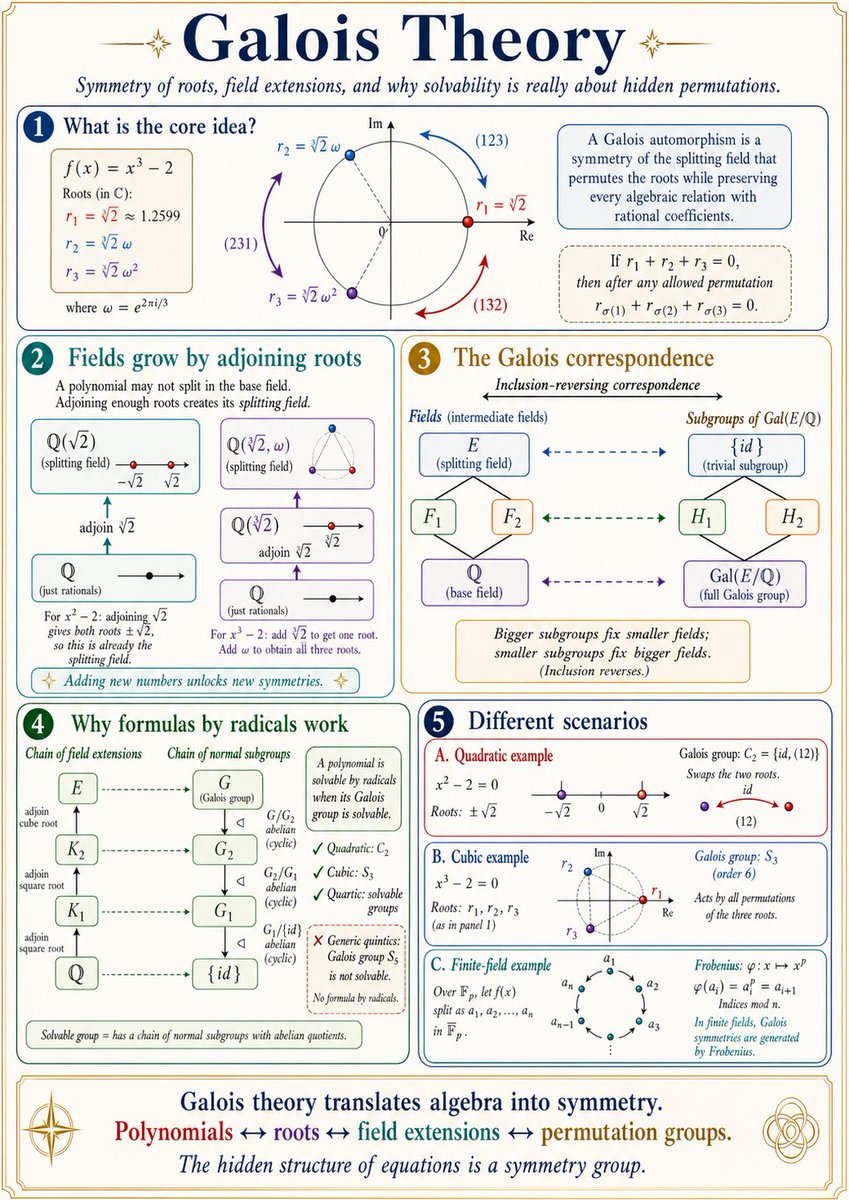
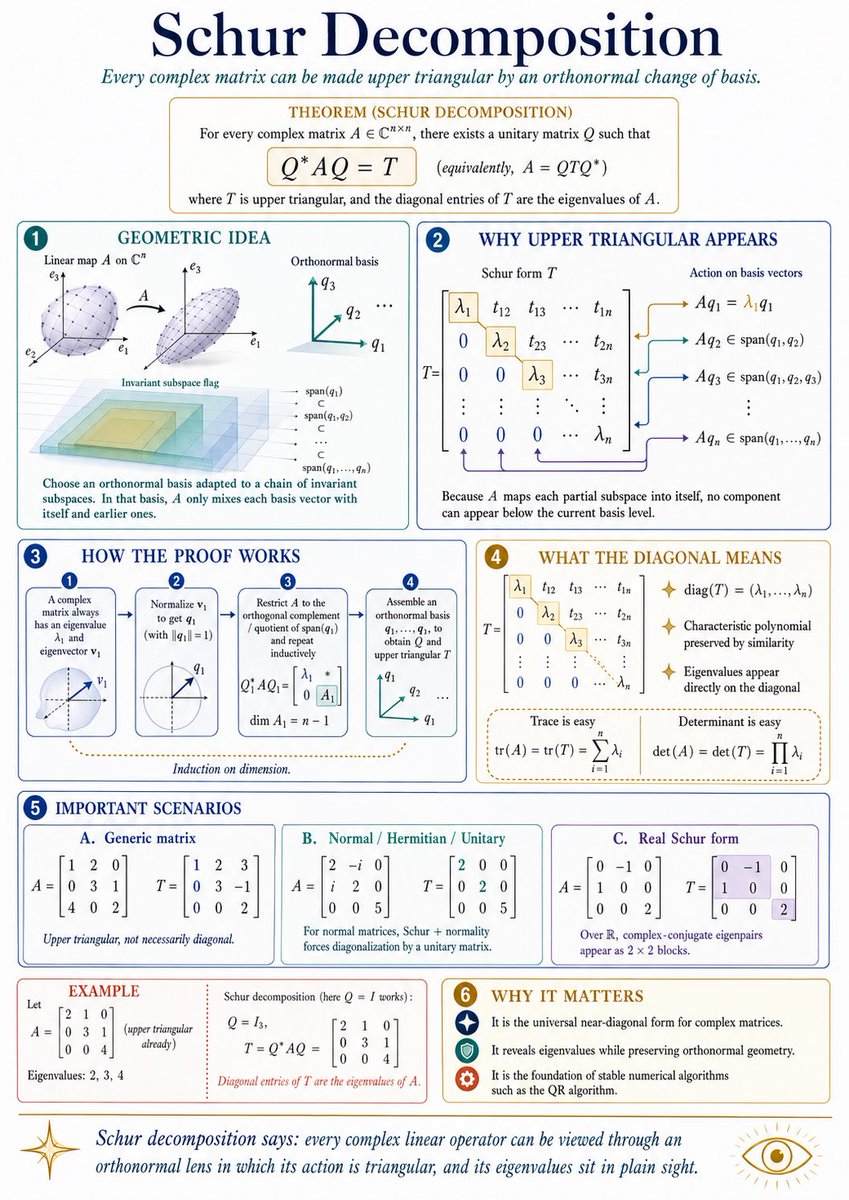
This prompt generates elegant and clear mathematical visualization infographics. It aims to explain a given mathematical concept's definition, proof, intuition, and applications, styled like a high-quality lecture note and educational poster.
Prompt
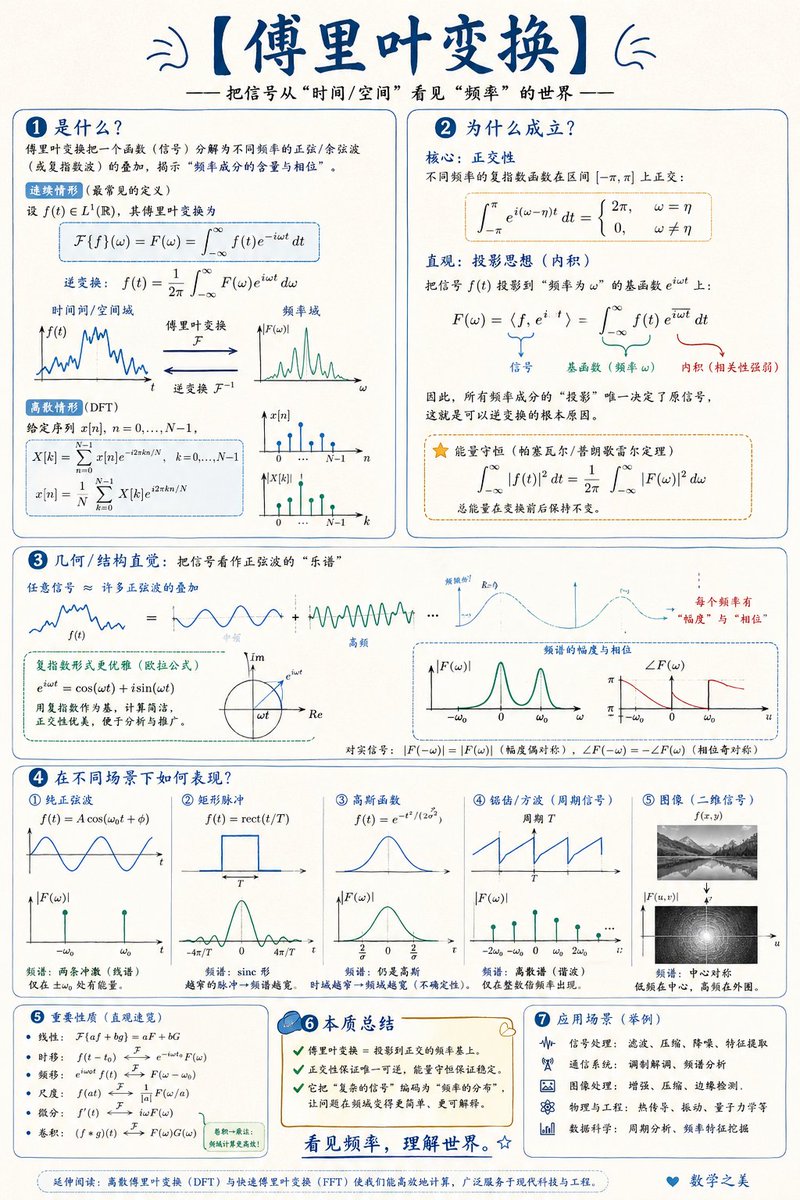
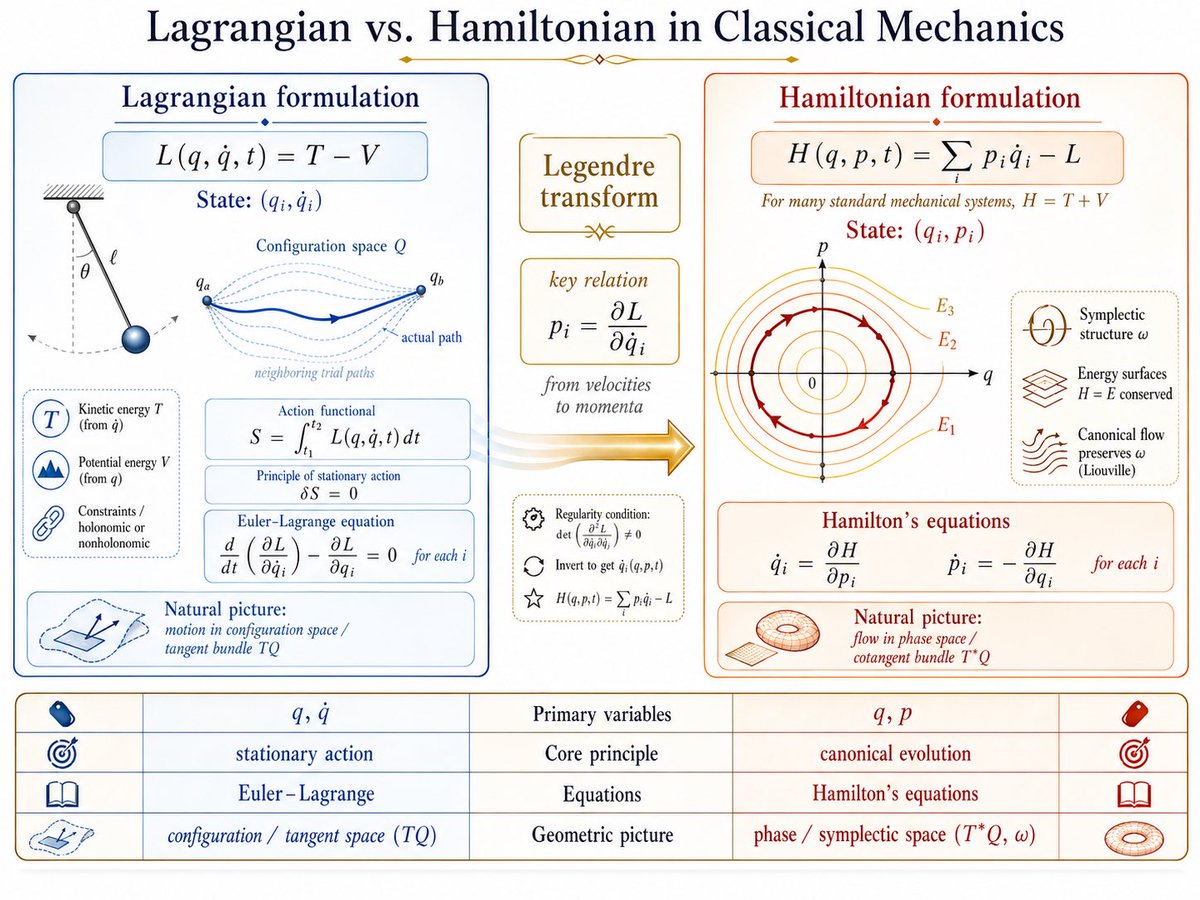
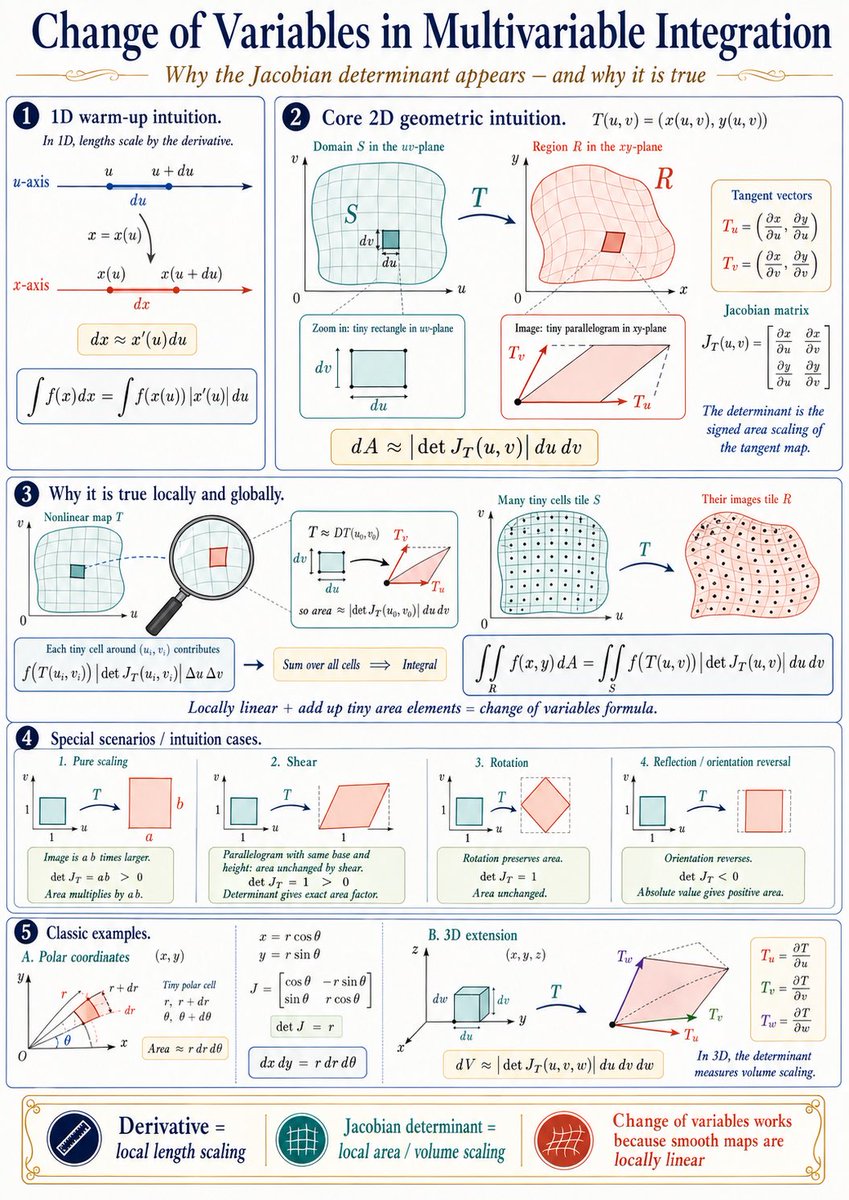
Please create a mathematical visualization infographic about '[Mathematical Concept/Knowledge Point]'. The goal is to help readers intuitively understand: what it is, why it holds true, its geometric/structural intuition, and how it behaves in different scenarios. The image should resemble a high-quality math lecture note + a hand-drawn educational poster, elegant, clear, and information-rich, but not cluttered.
Visual style: Can be vertical or horizontal, with a clean light-colored paper background, dark blue titles, black/dark gray body text lines, accented with a small amount of elegant blue, teal, gold, and red. Use rounded cards, thin line borders, numbered labels, hand-drawn arrows, localized magnification boxes, and summary sections. Overall, it should be aesthetically pleasing, balanced, and academic, allowing people to grasp the 'structure' and 'why' of the concept at a glance.